Attention: Here be dragons
This is the latest
(unstable) version of this documentation, which may document features
not available in or compatible with released stable versions of Godot.
Checking the stable version of the documentation...
Instruments
См. также
Please see the sampling profiler instructions and the tracing profiler instructions for more information.
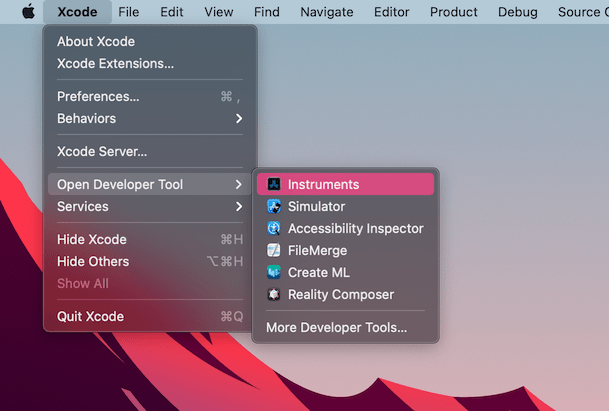
Open Xcode. Select Open Developer Tool - Instruments from the Xcode app menu:
Дважды щелкните Time Profiler в окне Instruments:
In the Time Profiler window, click on the Target menu, select Choose target... and specify the path to the Godot binary, command line arguments, and environment variables in the next window.
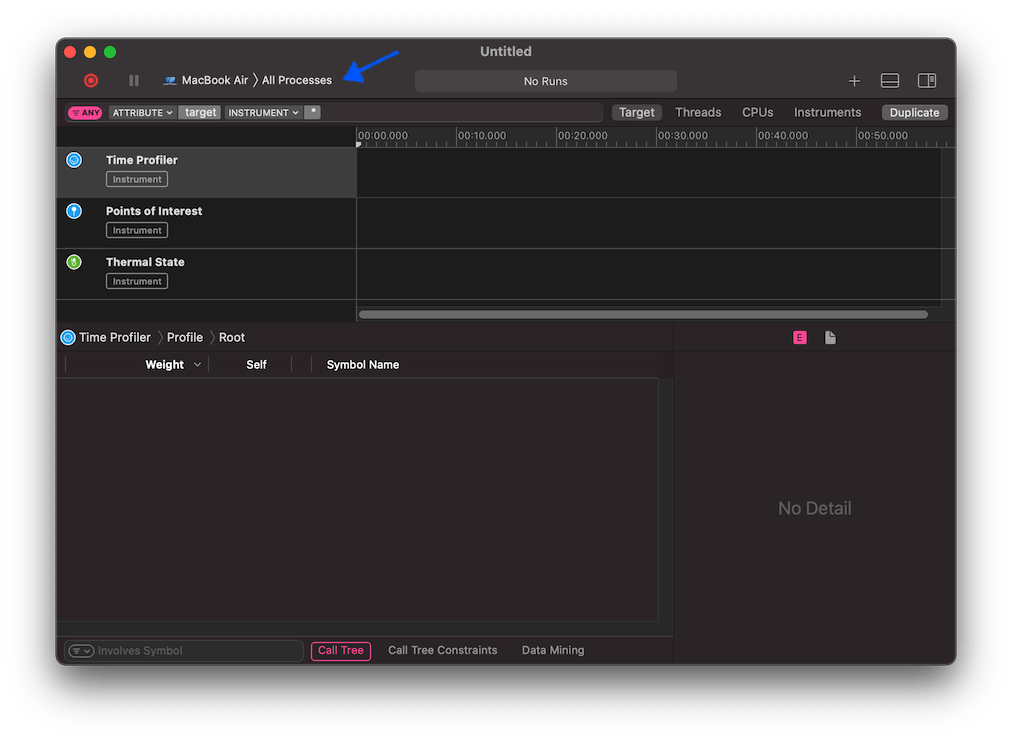
Вы также можете прикрепить Time Profiler к запущенному процессу, выбрав его в меню Target.
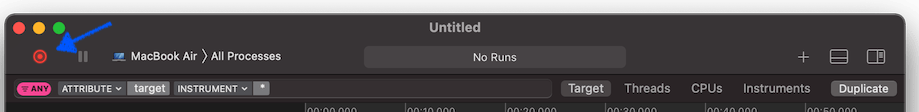
Нажмите кнопку Start an immediate mode recording (Начать запись в немедленном режиме), чтобы начать профилирование.
Выполните действия, которые вы хотите профилировать в редакторе или проекте. Когда закончите, нажмите кнопку Стоп.
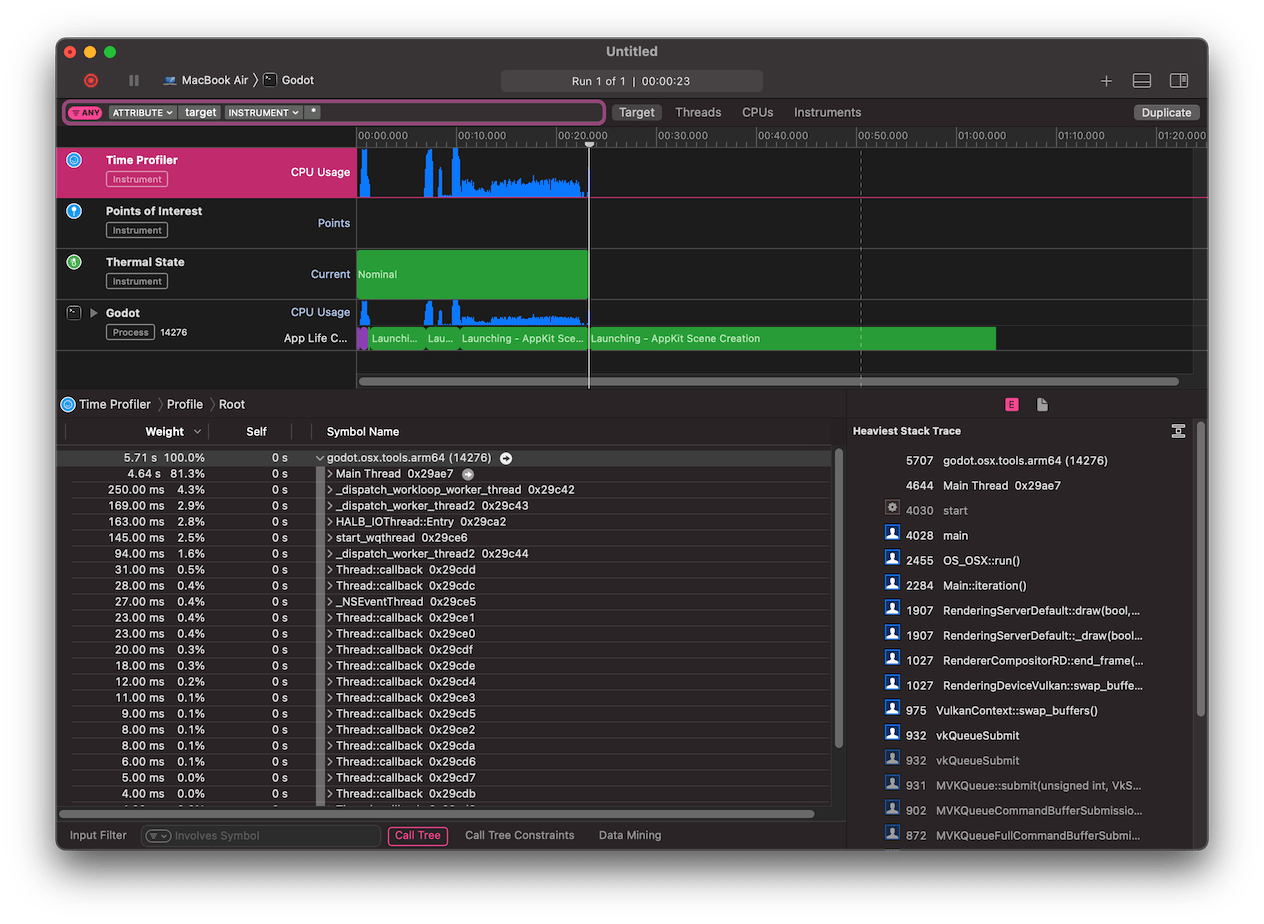
Подождите, пока появятся результаты.
В нижней части окна вы увидите дерево вызовов для всех запущенных потоков ЦП, а также обзор Heaviest Stack Trace.
Select Hide system libraries in the Call Tree menu (at the bottom of the window) to remove external modules.
Вы можете использовать временную шкалу в верхней части окна для отображения подробностей за определенный период времени.